This new version represents one of the biggest upgrades to the OMS Platform since initial release.
-
Walk Forward Correlation (WFC)
Walk Forward Correlation (WFC) is a ground‑breaking diagnostic technique pioneered by Martyn Tinsley to solve one of the most persistent challenges in trading strategy development: separating genuine structural
edge from over‑fitting. Traditional walk‑forward testing evaluates only the single “best” parameter set on the out‑of‑sample dataset—an approach that often masks instability and creates false confidence. WFC
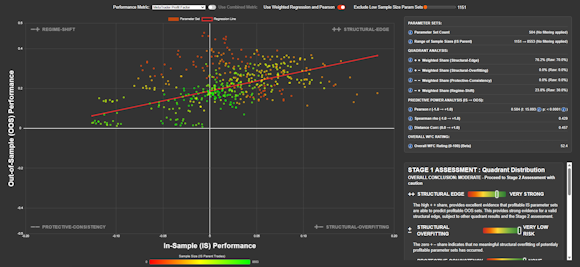
takes a fundamentally different perspective by measuring the correlation between the full in‑sample optimization surface and the corresponding out‑of‑sample performance. This exposes whether a strategy’s behaviour
is predictable, consistent, and robust across walk‑forward windows, or whether its apparent success is merely noise and curve‑fit variance.
By integrating WFC directly into OMS, traders gain a powerful new lens for assessing strategy quality before committing capital. High Walk Forward Correlation indicates that a strategy’s edge persists across market
regimes, parameter variations, and walk‑forward segments—providing far greater confidence in live deployment. Low or negative correlation highlights fragility early, enabling developers to refine, rebuild, or
discard weak ideas before they become costly mistakes. This release represents a major step forward for OMS users, bringing a research‑grade robustness metric—developed by Martyn Tinsley and now gaining traction
across the quant community—into a seamless, production‑ready workflow.
To get up to speed as quickly as possible, we recommend you visit our WFC playlist on YouTube.
-
Greatly improved Example Dashboard (with WFC Integration)
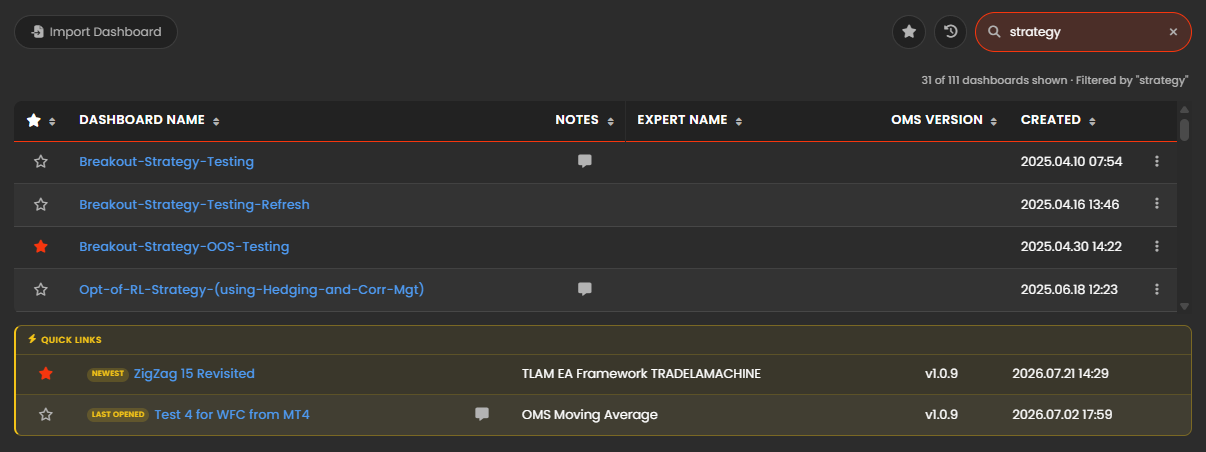
We have completely overhauled the Example Dashboard in OMS. This is far more than a simple "how-to" guide or software feature showcase — it has been completely rebuilt as a premier educational masterclass in best-practice algorithmic strategy development.
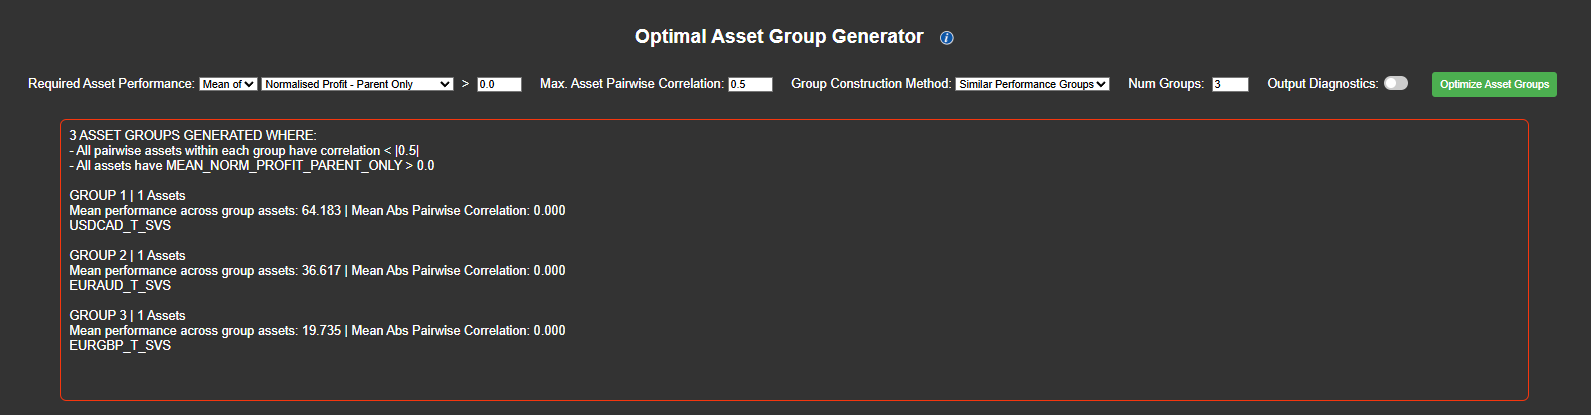
Many traders fall into the trap of hunting for an isolated "lucky" backtest parameter set, only for it to fail miserably in live production. The new Example Dashboard is specifically engineered to combat this by teaching you how to think, analyze, and operate like an institutional quantitative researcher. By walking through a complete, end-to-end research workflow, you will learn how to interrogate an optimization surface, rigorously filter assets, analyze temporal market regimes, and confidently separate genuine structural edge from market noise using WFC.
Crucially, this updated dashboard now features full integration of our groundbreaking Walk Forward Correlation (WFC) diagnostic tool. WFC fundamentally redefines strategy validation by measuring whether your in-sample (IS) optimization surfaces genuinely predict out-of-sample (OOS) performance across the entire parameter space. The Example Dashboard provides the perfect, data-rich environment to see WFC in action, helping you understand how to integrate this powerful mathematical gate into your own development pipelines to help eliminate excessive curve-fitting once and for all.
Why This is a "Must-Do" Review for All Users:
- For New & Free-Tier Users: This provides a completely unrestricted sandbox to experience the full analytic depth of the Pro featureset while simultaneously learning an institutional development framework.
- For Experienced OMS Veterans: Even if you are already deeply familiar with the OMS platform, reviewing this dashboard from start to finish is highly recommended. Reading the newly expanded, inline User Notes provides a masterclass in modern quantitative methods and demonstrates exactly how to deploy advanced tools like WFC to upgrade your personal research habits.
Don't just learn how to optimize your strategies — learn how to optimize your entire research philosophy. Make sure you dive into the new Example Dashboard today.
-
Description Prompt
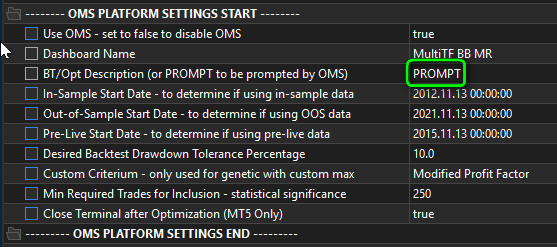
In response to customer feedback, users can now be prompted for Backtest/Optimization Descriptions at the moment they start a new test in MetaTrader, rather than relying on the EA’s input parameter field. This prevents the common issue of forgetting to update the description before launching a test.
To enable this feature, simply enter PROMPT in the BT/Opt Description field within the EA input parameters. OMS must already be running before the Backtest/Optimization begins; if it is, the user will be prompted automatically to enter their description.
-
Improved Parameter Selection Algorithms
The algorithms powering the Parameters tab in each optimization have received a significant upgrade. Trade Sample Size is now incorporated into the selection logic in a far more intelligent and statistically aware way. This helps prevent the selection of parameter sets that appear strong purely due to variance or insufficient trade counts, resulting in more reliable and meaningful optimization outcomes.
-
Improved Sample Size Adjustment on Optimization Charts tab
The algorithm behind the Adj For Sample Size option on the Charts tab of Optimization results has been significantly refined. The updated method provides a more accurate comparative assessment between parameter sets by better accounting for differences in trade sample sizes.
-
OMS Journal
A new Journal feature has been added, allowing users to view a detailed log of key OMS events, warnings, and errors. This is particularly useful for troubleshooting and when contacting the OMS Support Team. The Journal is accessible from a new tile on the App Launchpad.
-
User Notes Resize Persistence
Multi‑line user‑notes fields now persist their dimensions after manual resizing. When the user drags the resize handle, the updated width and height are captured and written back to the dashboard configuration, ensuring the notes areas reopen with the same dimensions across sessions.
-
New Input Parameter: Holdout Start Date
In response to customer feedback, we have added a 'Holdout Start Date' input parameter to accompany the existing start dates for 'In-Sample', 'Out-of-Sample', and 'Pre-Live'. When running backtests and optimizations, these parameters ensure that the dataset used is accurately labeled in the title of the dashboard section, providing greater clarity. These date parameters remain fully customizable to align with your personal trading workflow.